
Splunk Reports
- Reports in splunk: For automating repetitive searches
- Report can be run on a schedule
Creating example report for the search "all ports used in network connections"
SCREENSHOT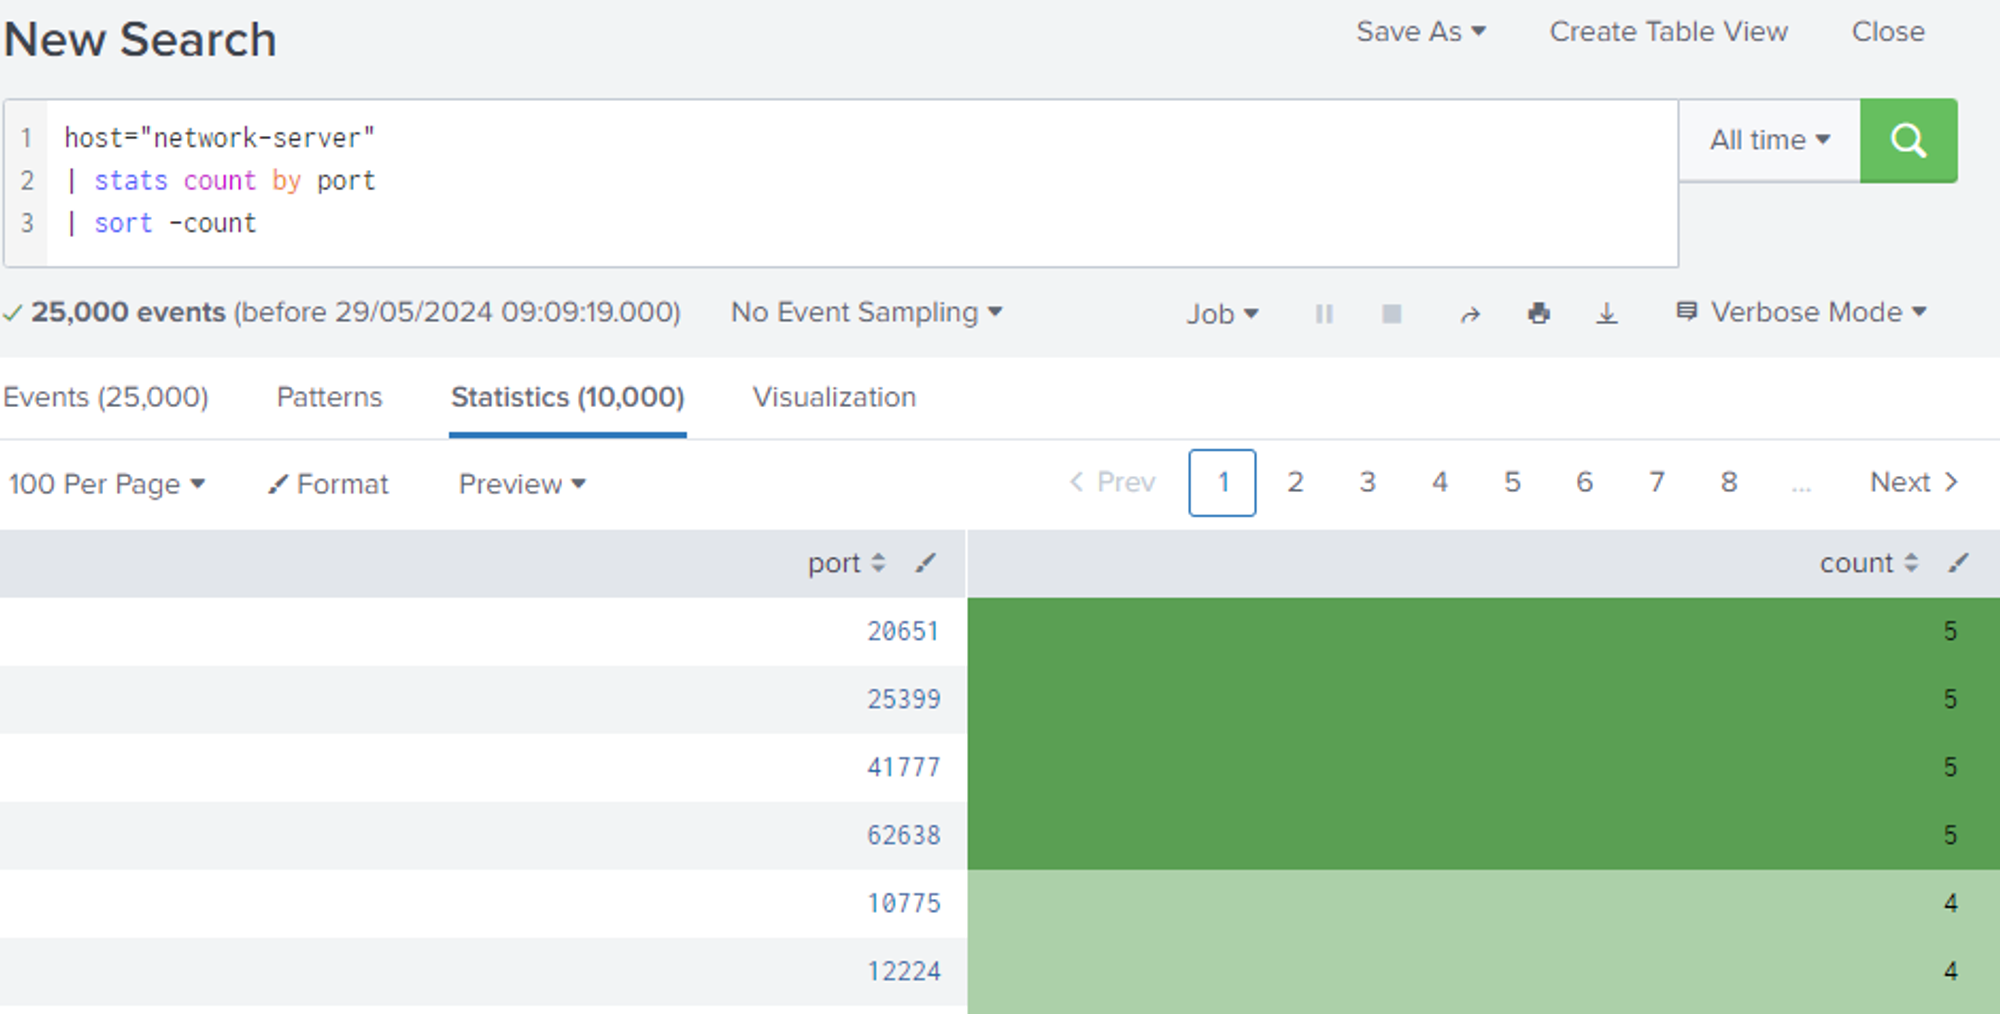
Description: Using the network-server host which contains all the network logs. The result is piped to the stats command to count all ports and the sort command sorts in reverse with the hyphen switch.
Creating the actual report
SCREENSHOT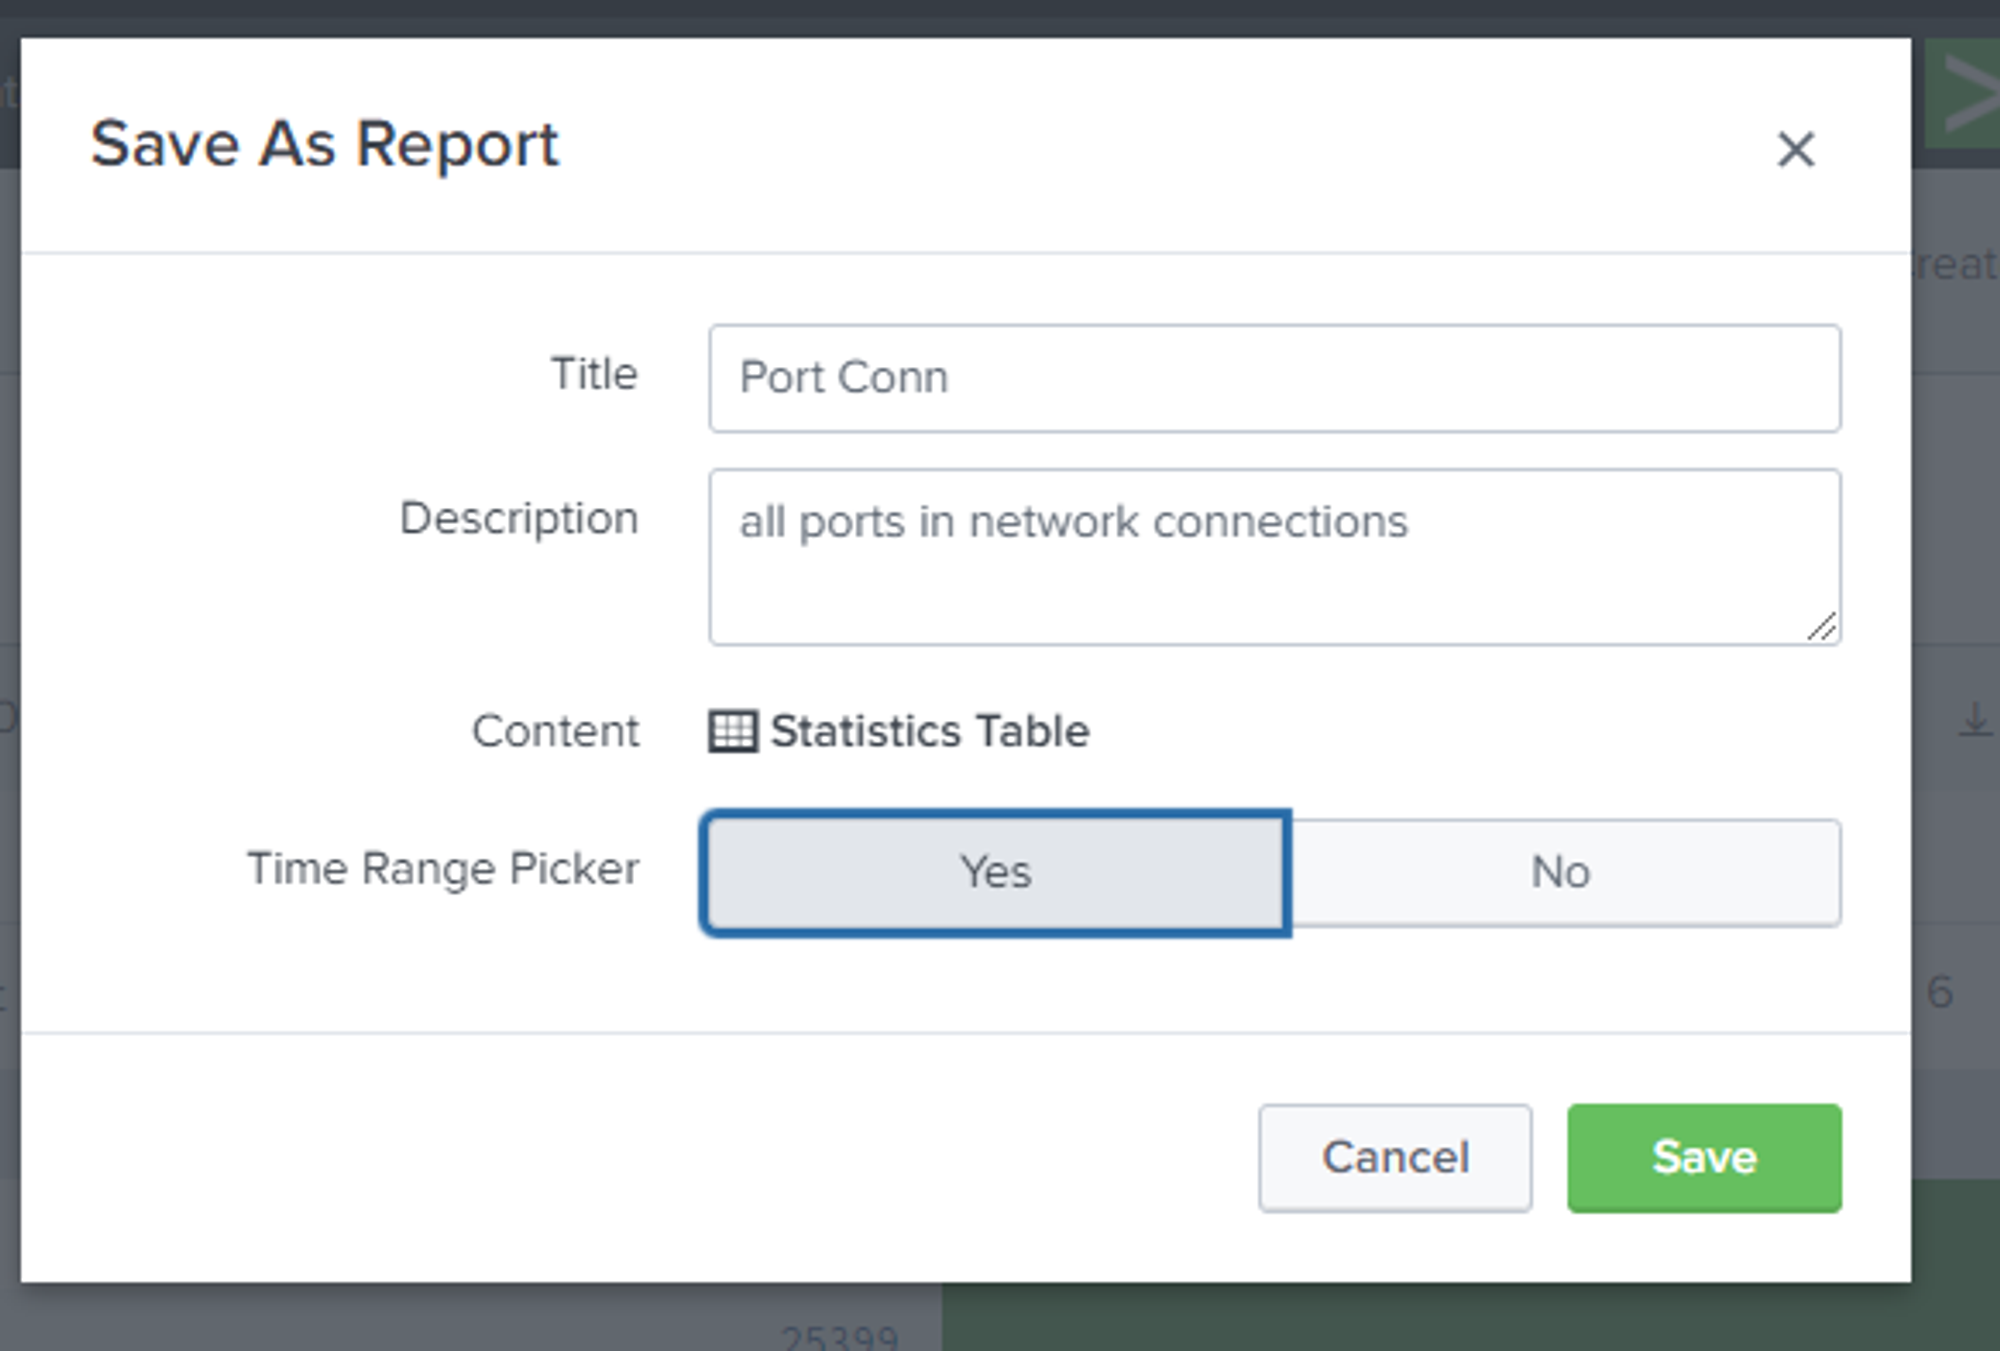
Description: Using save as option in splunk, search can be saved as a report, a dashboard or an alert
SCREENSHOT
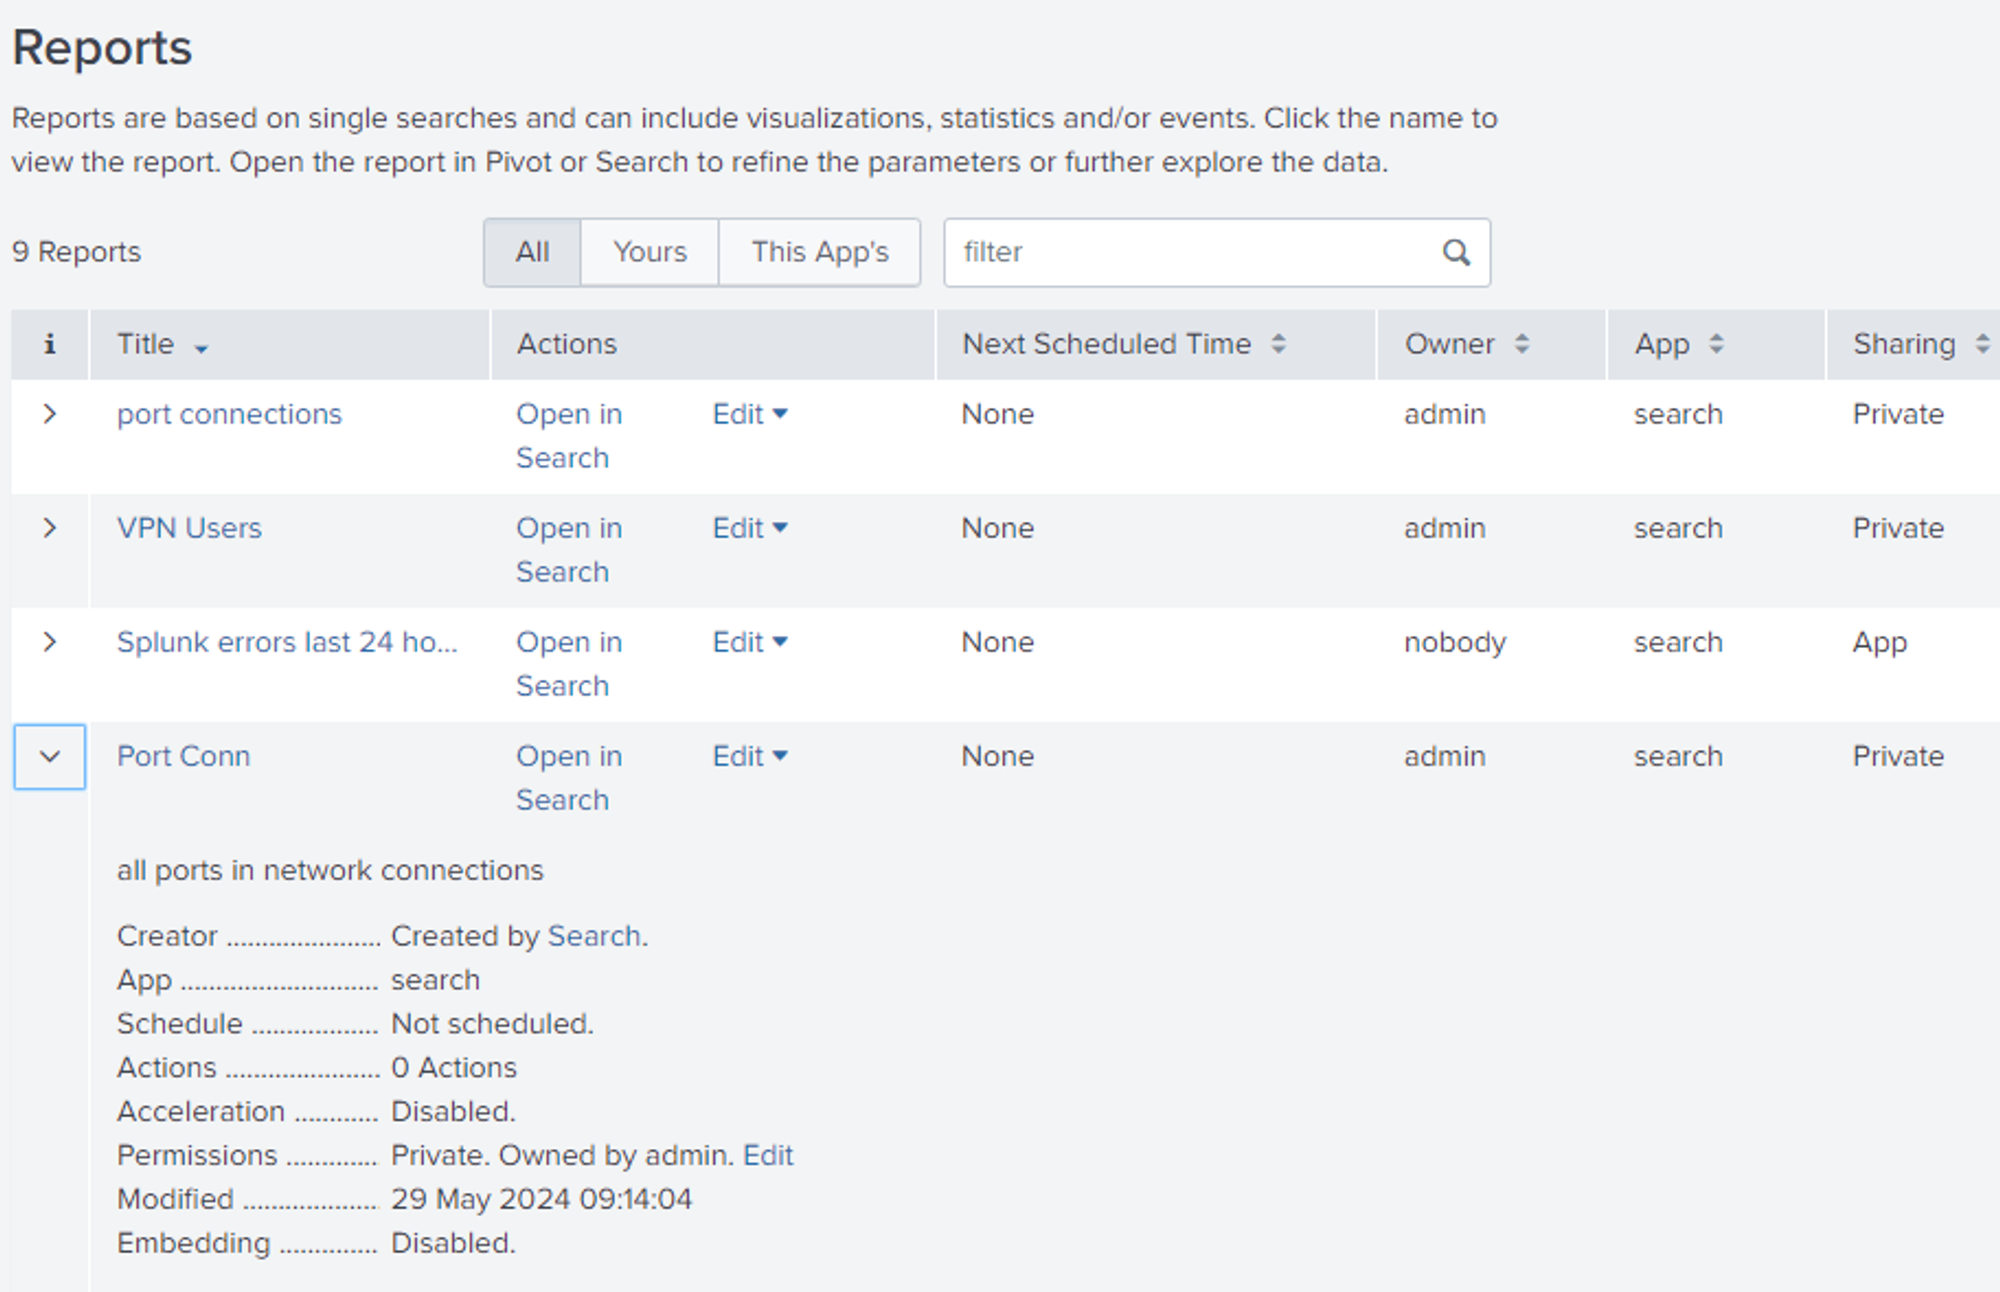
SCREENSHOT

Description: After a report is created permissions can be set to limit access. One of the three main RBAC Role Based Access Control that splunk uses can be set, either private to limit access to the owner of the report or give access to the splunk app instance or allow access outside the app.
Study Guide: TryHackMe Soc2 Dashboards and Reports
Splunk Dashboard
- Splunk dashboards: For visualising findings in data
Creating example dashboard for User connection via VPN
After a regular search, save as option in splunk is used to save the search as a report, this starts the creation of a report.
SCREENSHOT
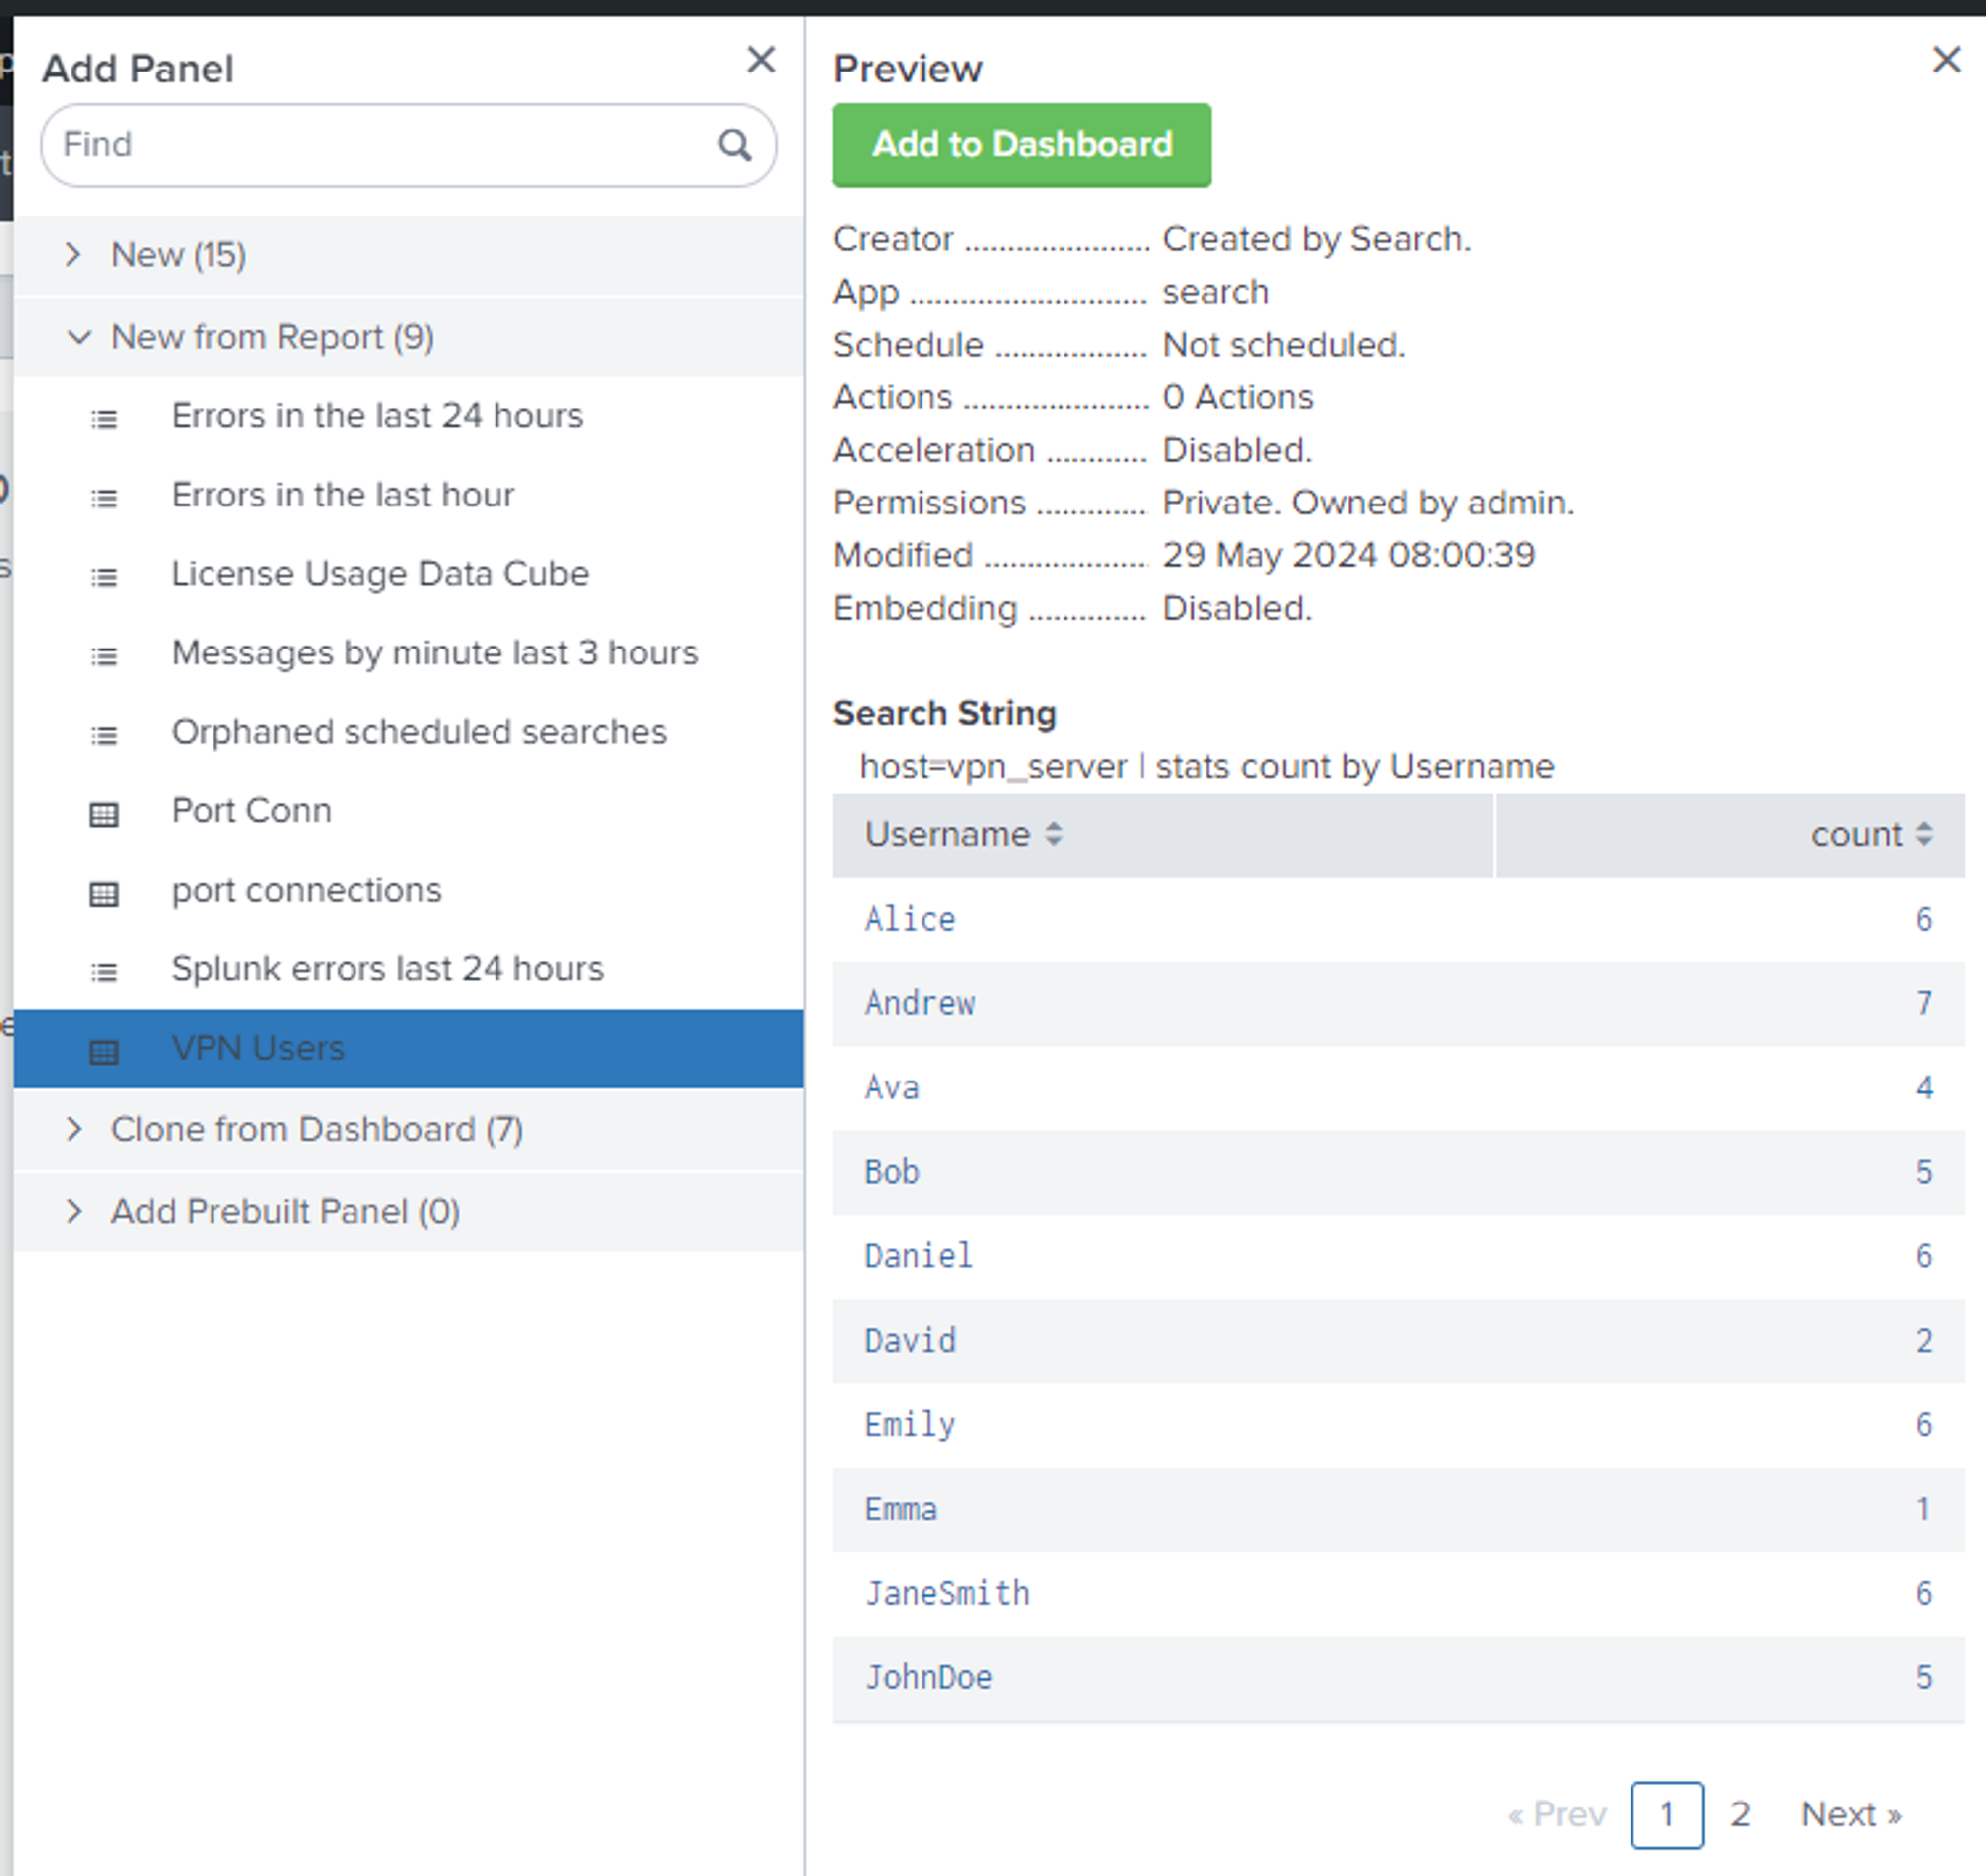
Description: Adding in data via the Add Panel option in splunk
SCREENSHOT
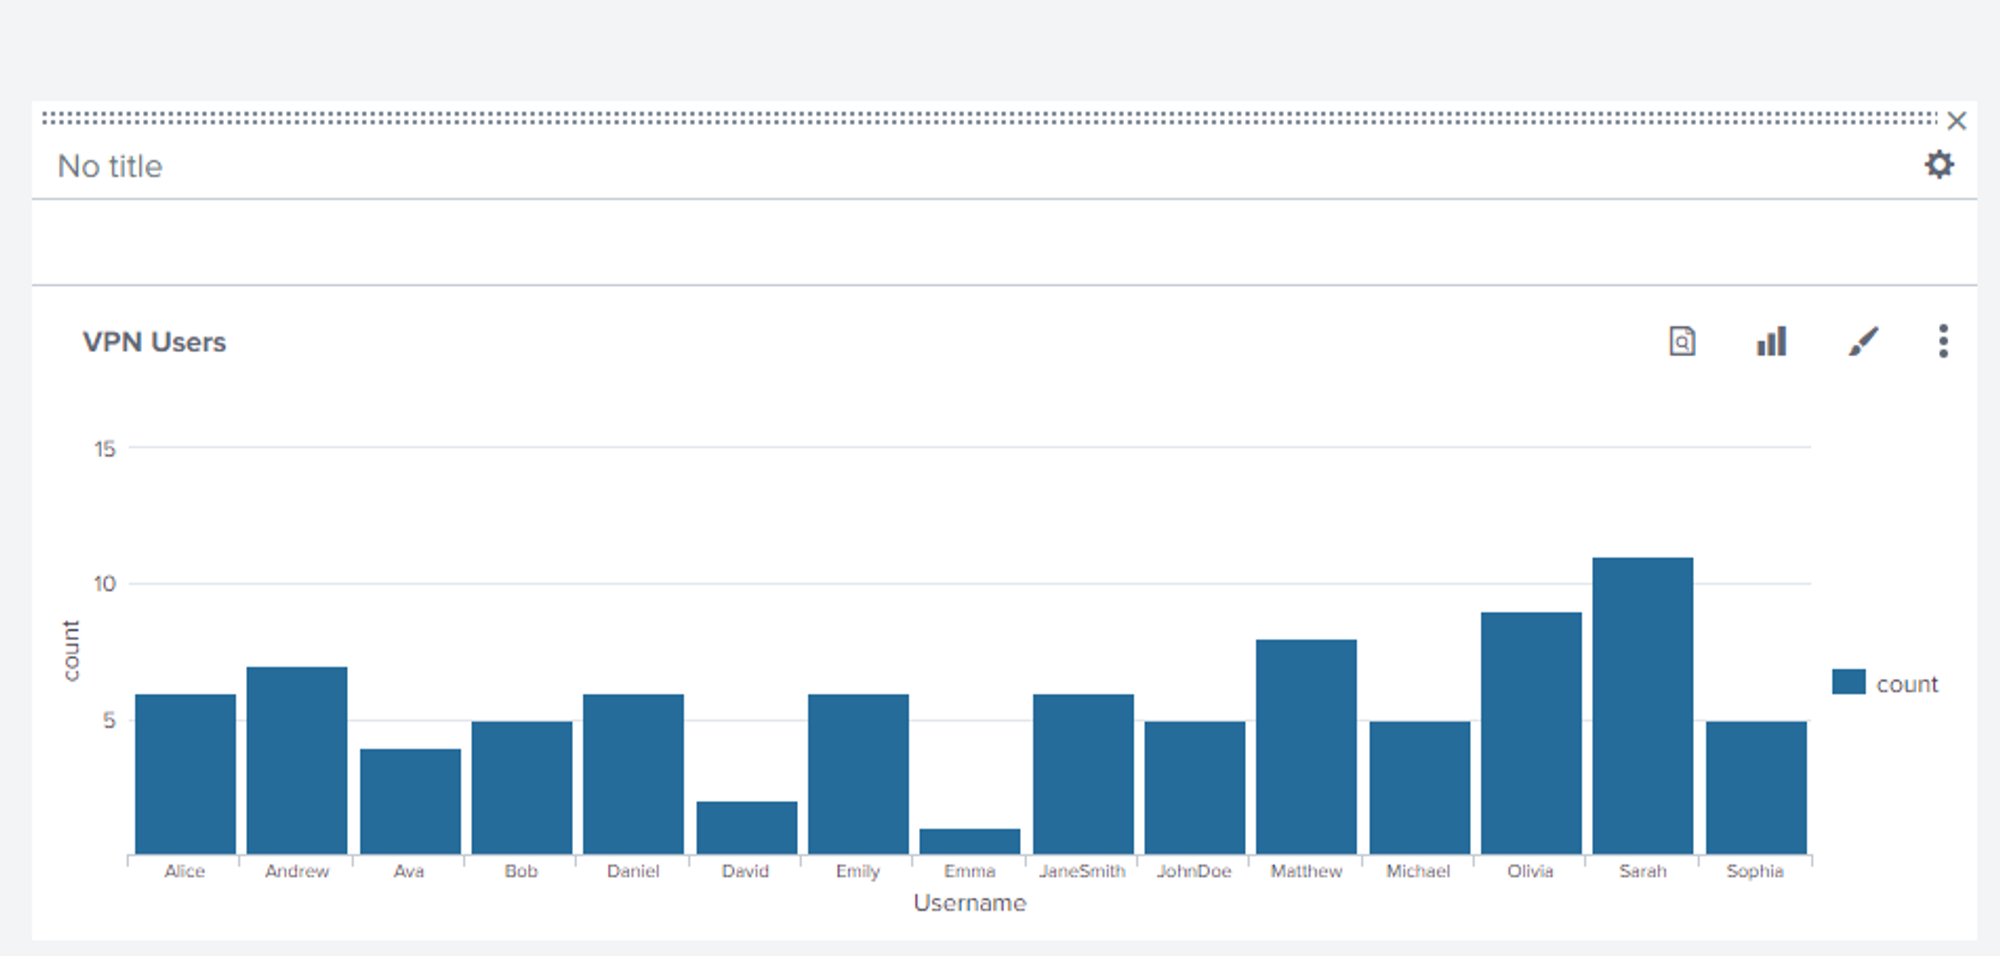
Description: A bar chart representation of the data in the dashboard
SCREENSHOT
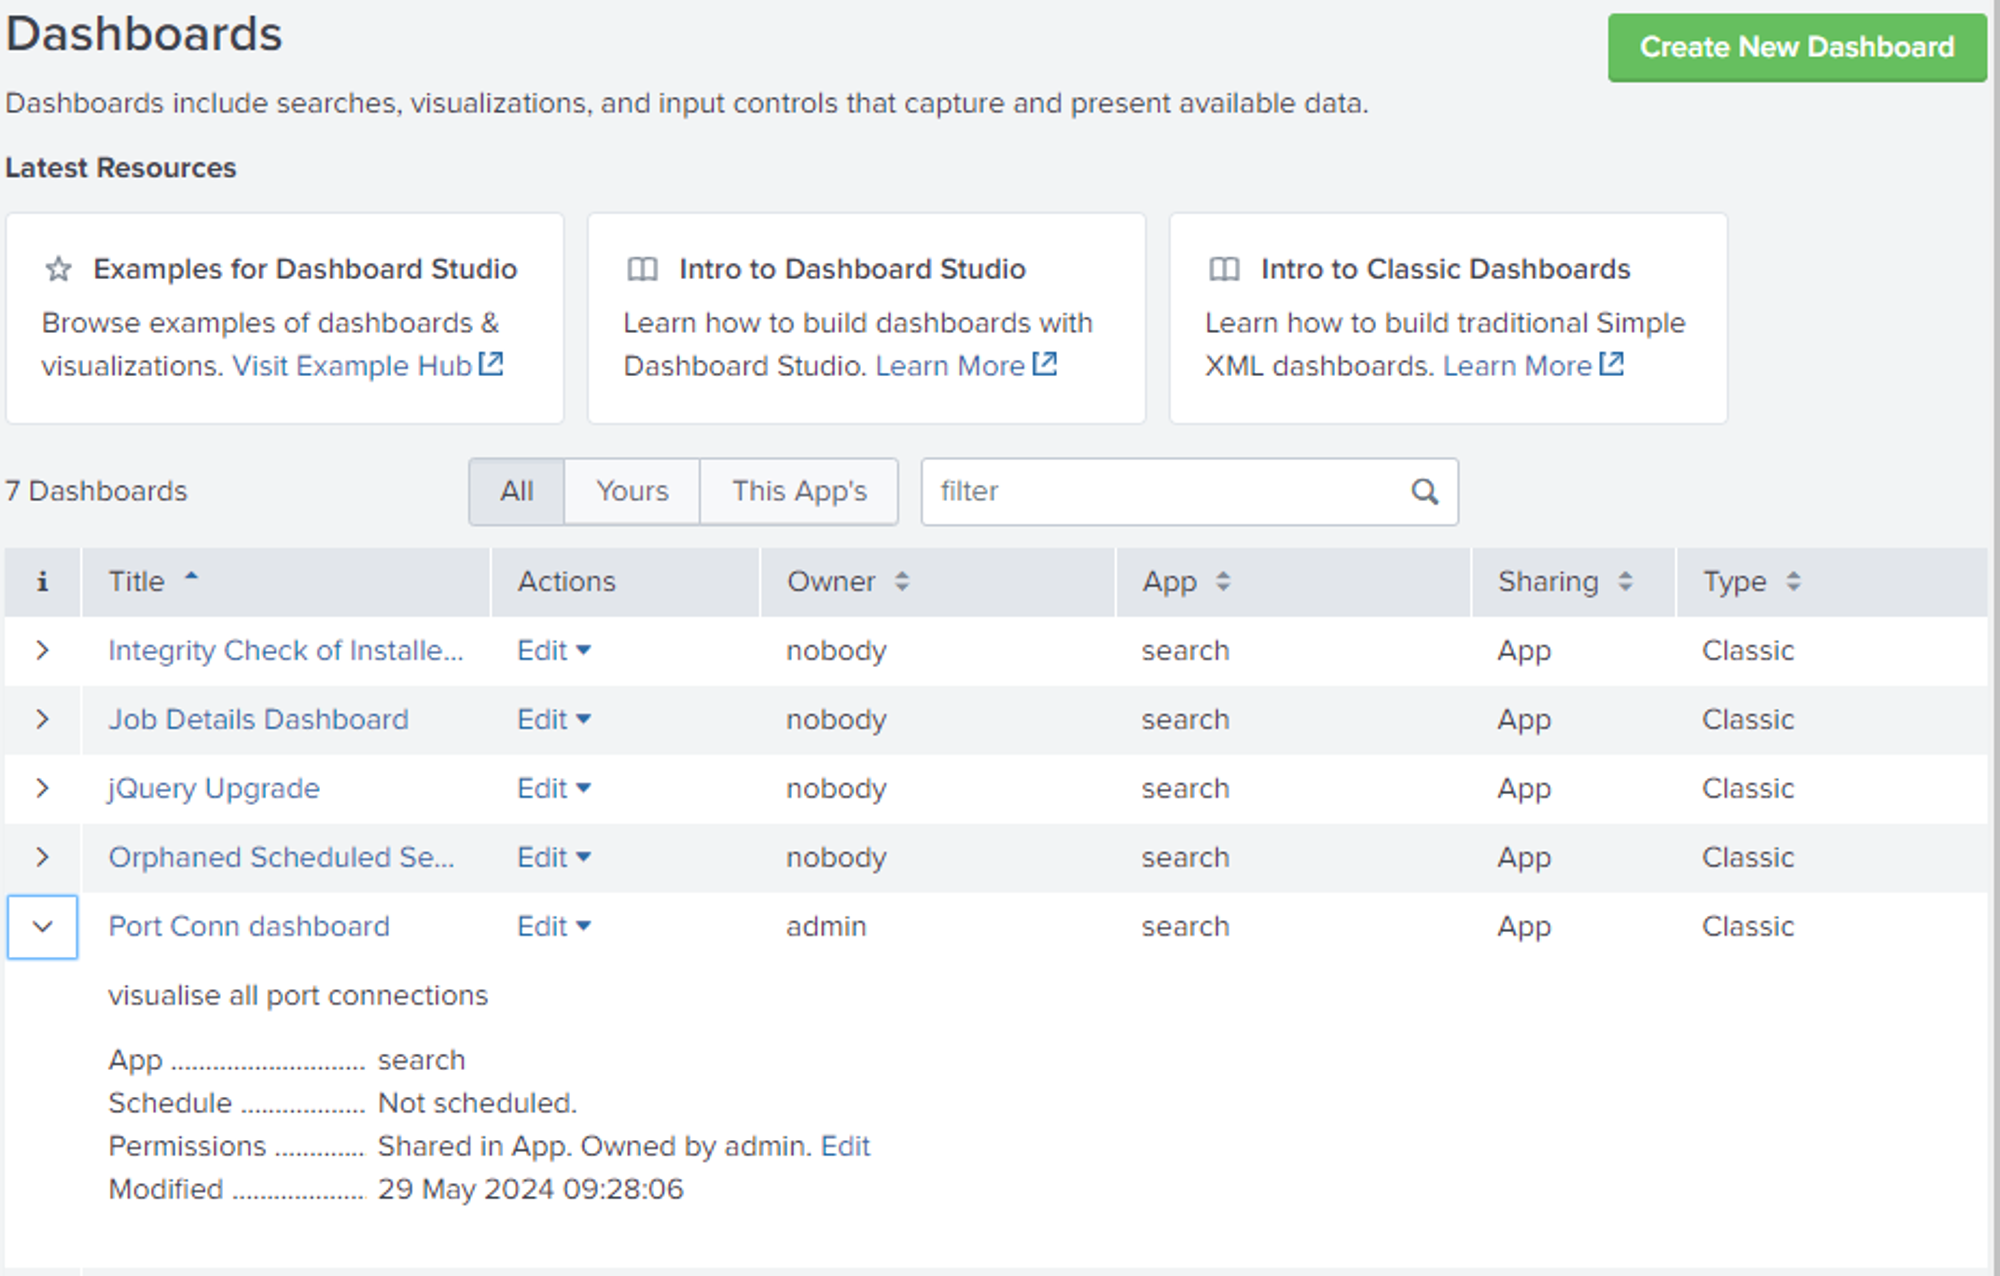
Description: Under dashboard tab are all saved dashboards and permission if needed can be set
Study Guide: TryHackMe Soc2 Dashboards and Reports
Data Manipulation
Creating an APP
SCREENSHOT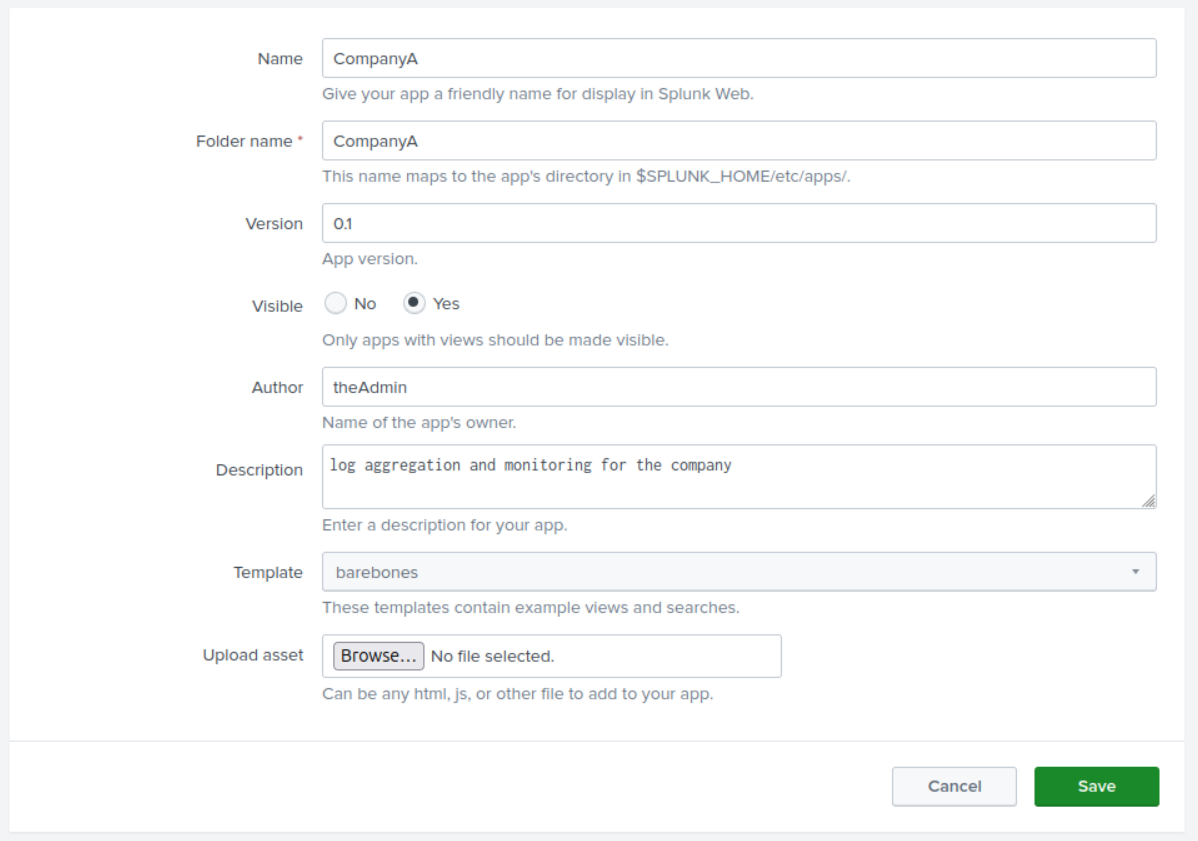
Description: Under App settings, used the create app option to complete a simple app
Default App directory is appended to splunk-installed-dir/etc/apps/"customApp".
App Configuration files
- inputs.conf: To specify log source
- props.conf: To specify the processing option to apply before indexing
- transforms.conf: To extract custom fields
- fields.conf: To specify fields/variables to index in the data
Event Boundaries
/using a sample VPN_LOGS
SCREENSHOT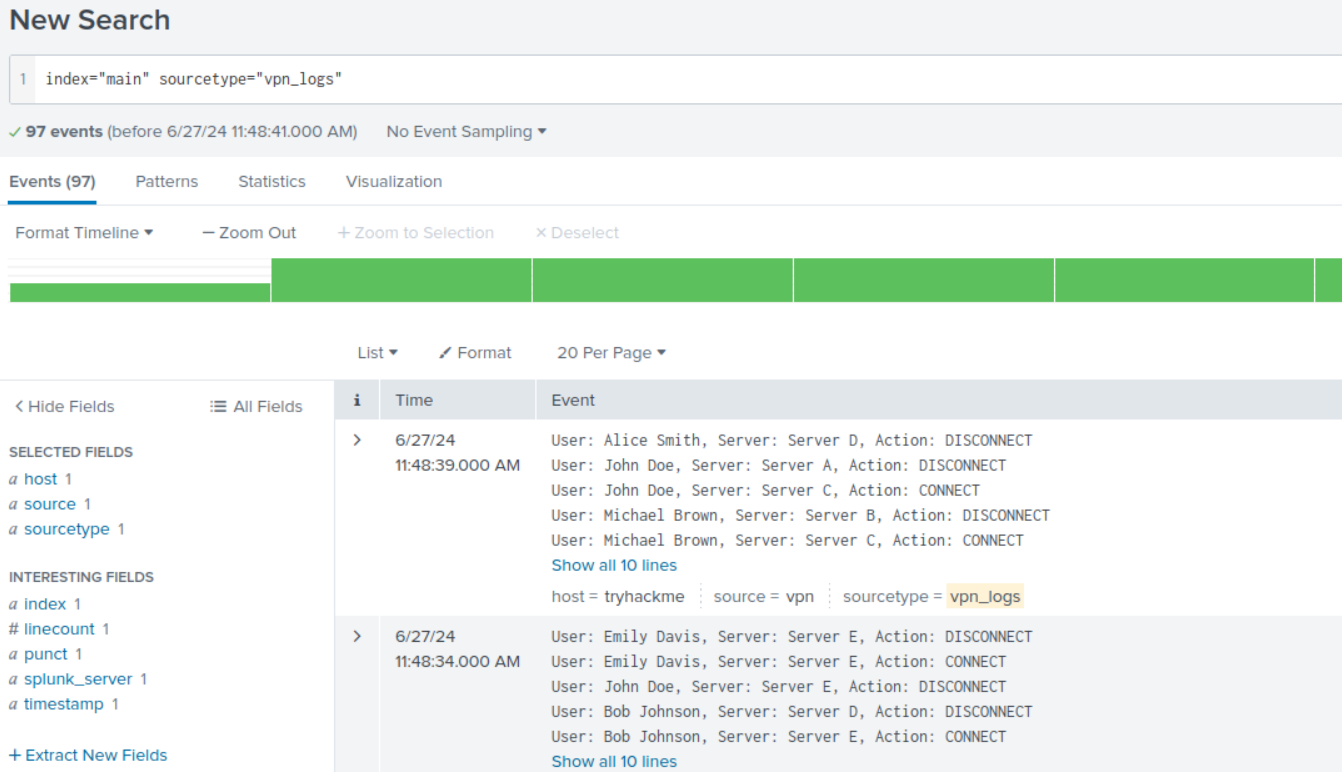
Description: Splunk isn't breaking the end of events by default.
SCREENSHOT
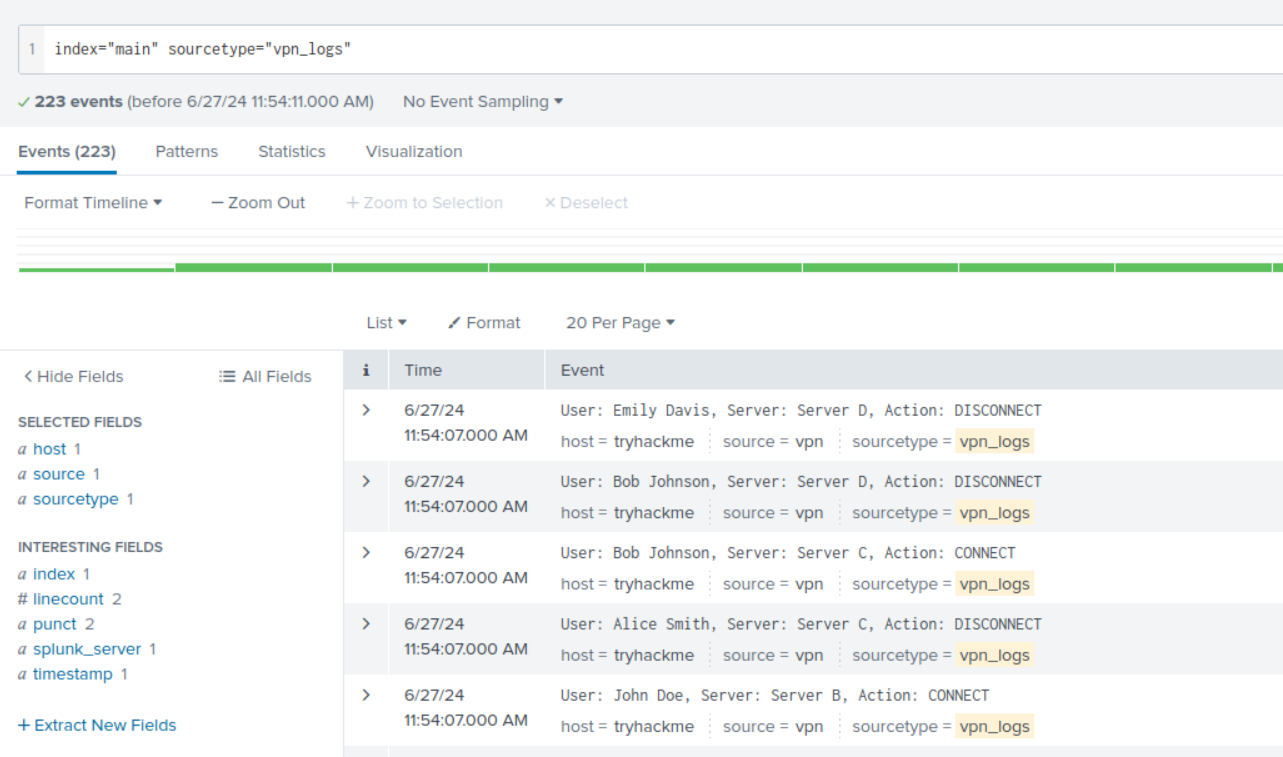
Description: Used props.conf and REGEX expression to break the events
Masking sensitive Data
Using sample purchase log
SCREENSHOT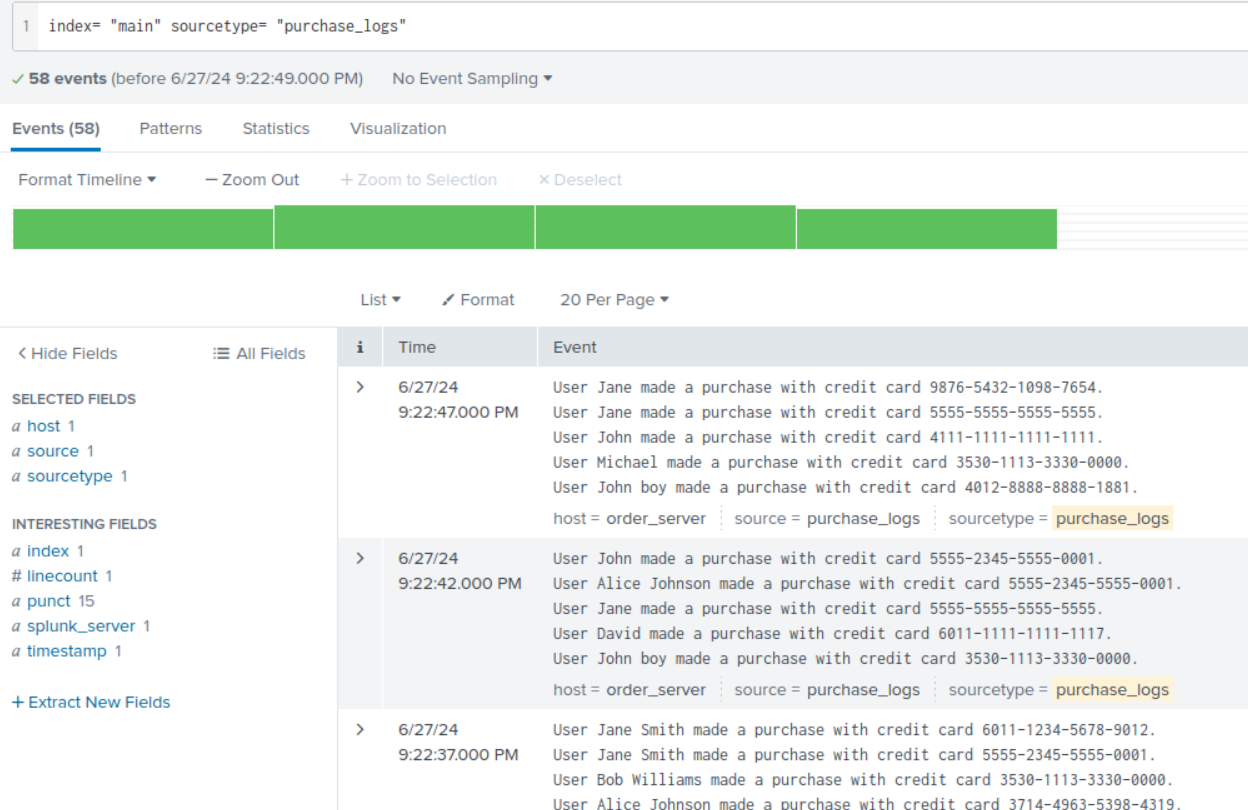
Description: In these events credit card details are exposed
SCREENSHOT
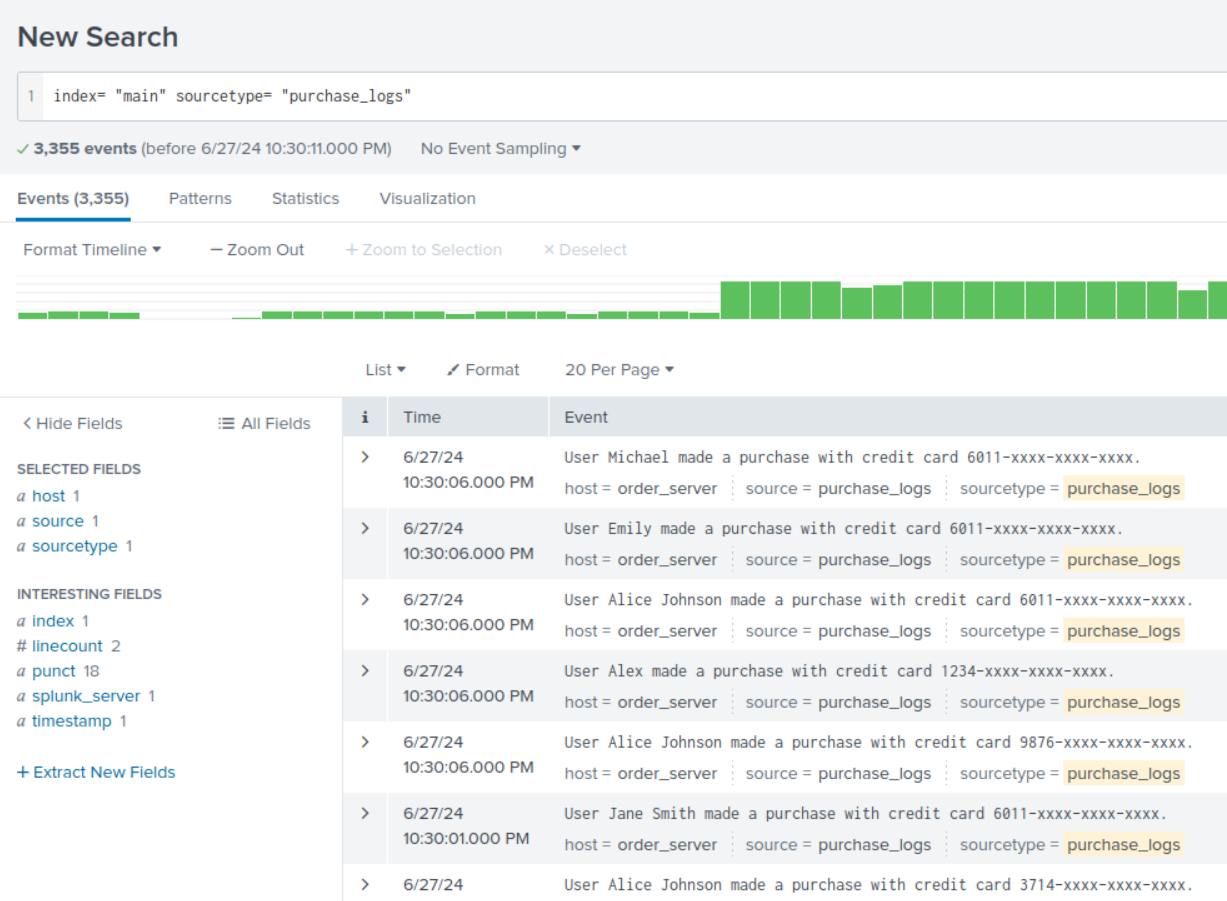
Description: In props.conf, used REGEX to replace part or the credit card details
Extracting Custom Fields
SCREENSHOT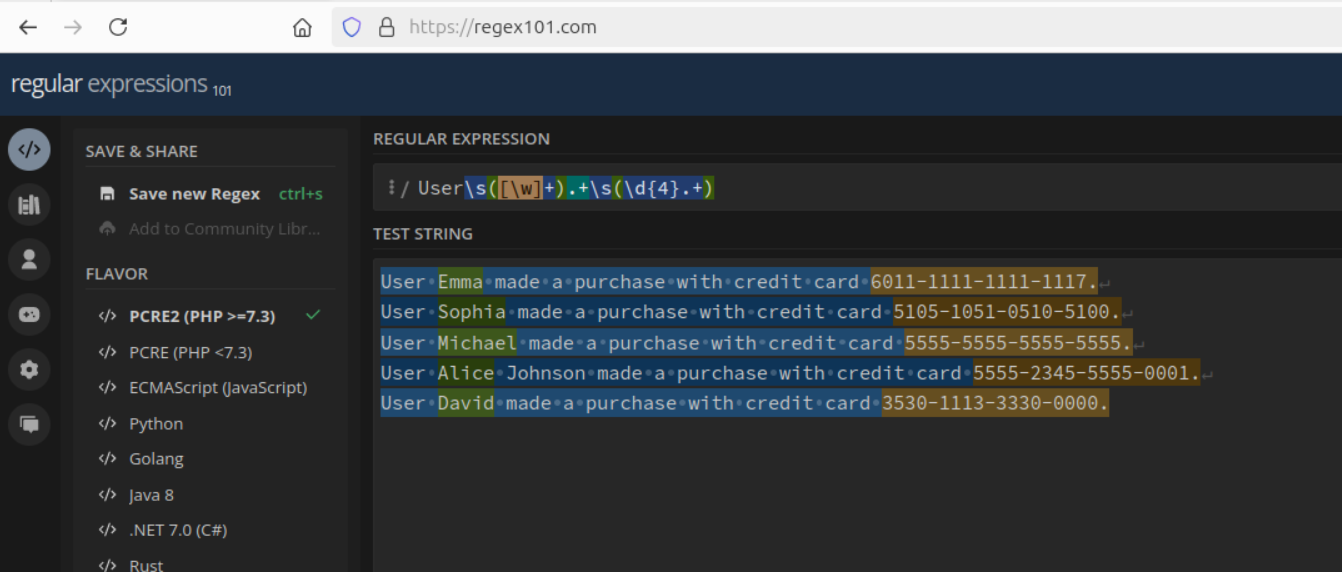
Description: First the REGEX to use to extract interested fields
SCREENSHOT

Description: Then in transforms.conf, applied the regex and defined field names
SCREENSHOT
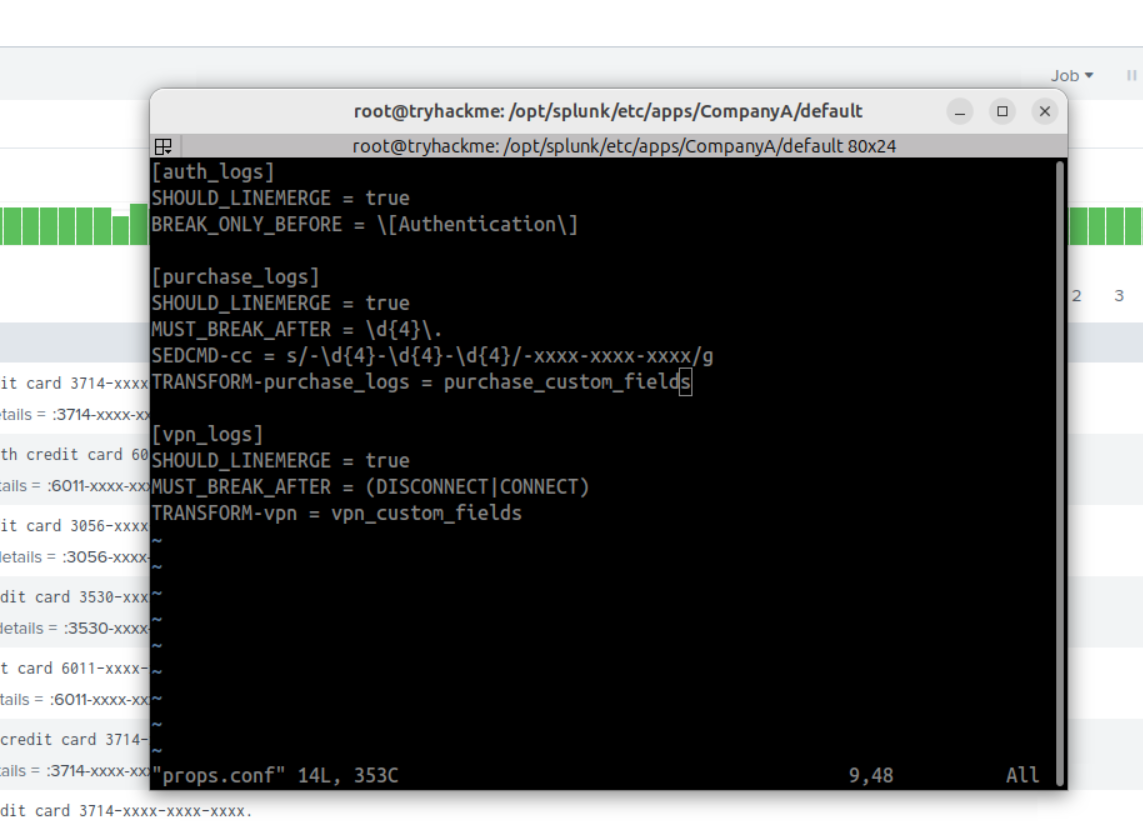
Description: In props.conf, included the tranforms to be processed before indexing
SCREENSHOT
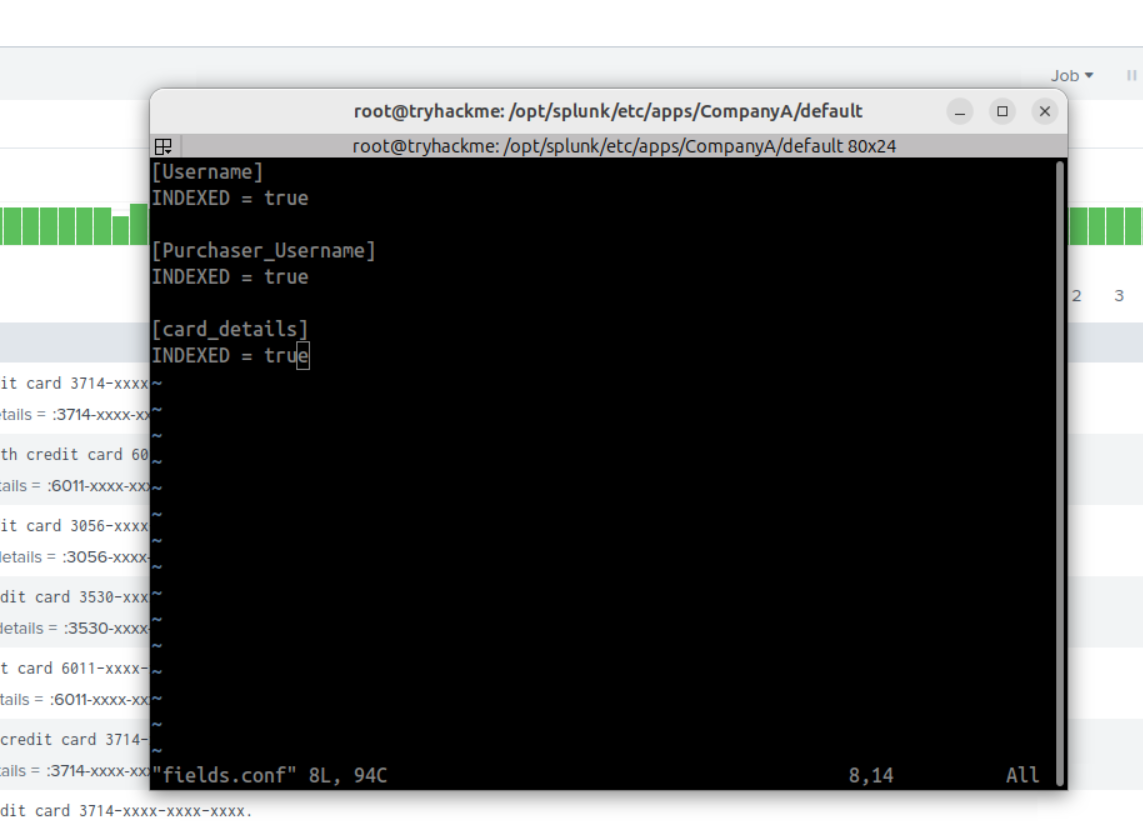
Description: In fields.conf, specified the field names to be indexed
SCREENSHOT
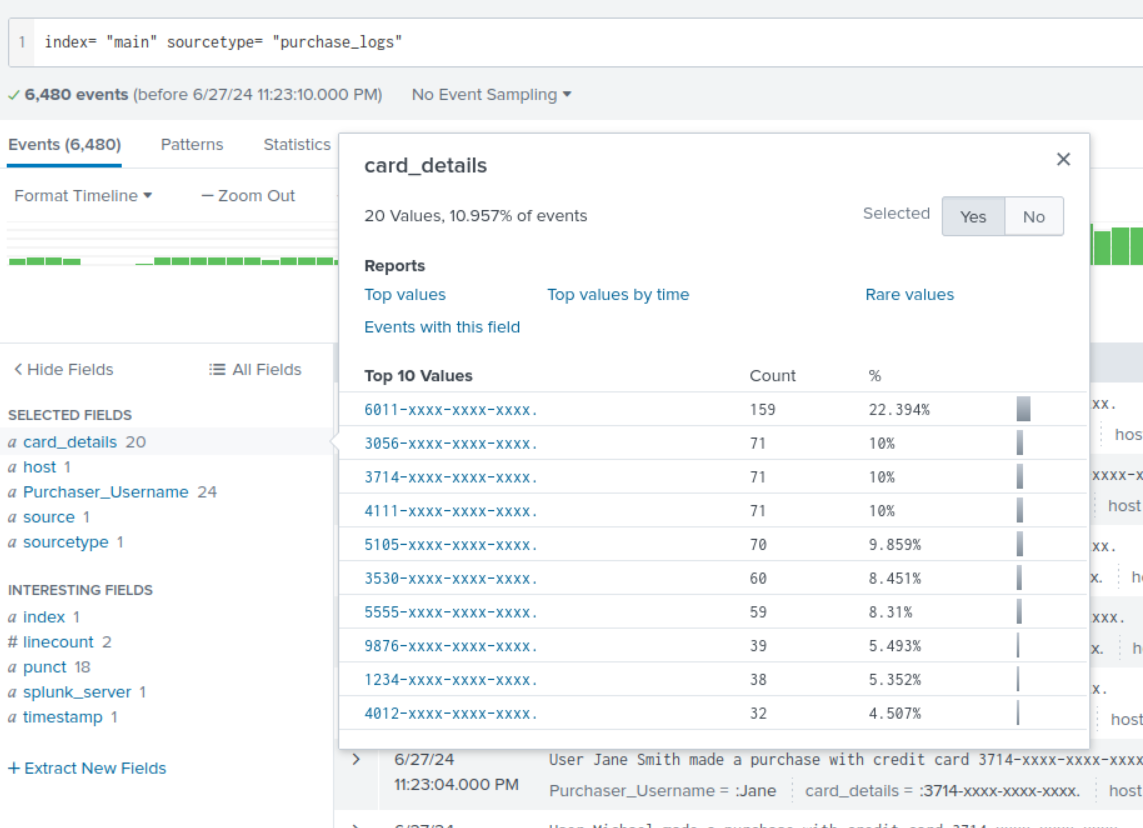
Description: The extracted fields purchaser_username, card_details
SCREENSHOT
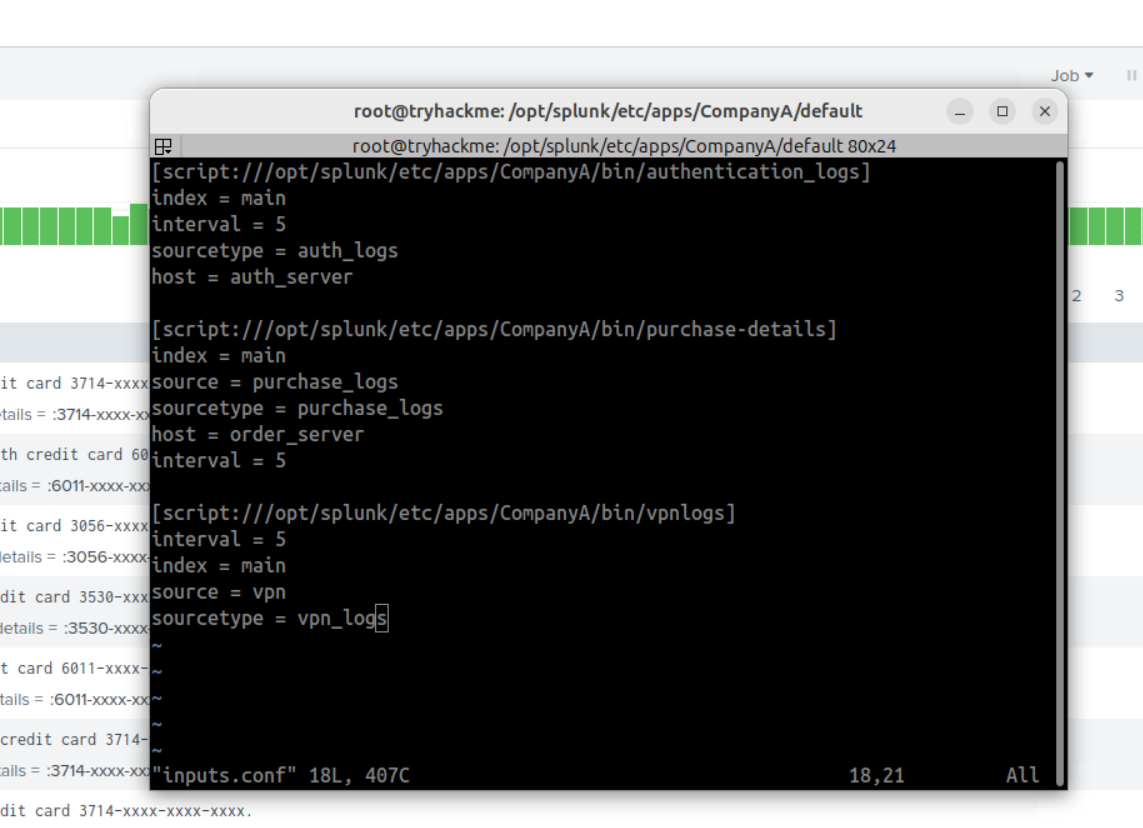
Description: inputs.conf